
An NBA scoreboard looks simple at first glance, but every number on the screen tells a story about pace, shot quality, momentum, and strategy. For new fans, the challenge is not reading the score itself; it is understanding what the clock, fouls, bonus indicator, possession arrow, shooting splits, and player lines actually mean in live game context. I have spent years breaking down broadcasts with first-time viewers, and the same pattern always appears: once fans learn the scoreboard, the game becomes easier to follow, predict, and enjoy. This guide explains every common number and symbol shown on an NBA scoreboard and frames them within the broader world of stats for fans.
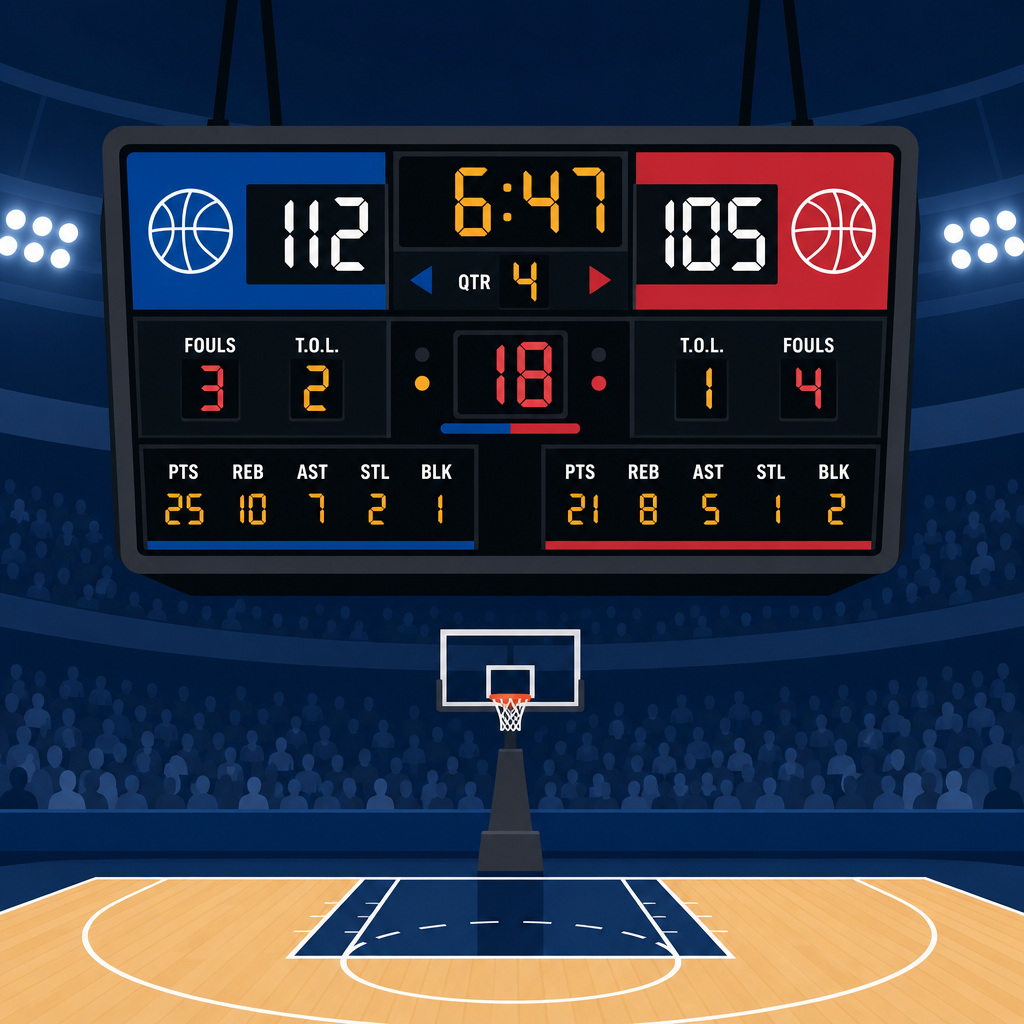
In NBA broadcasts, the scoreboard is the compact graphic, usually at the top or bottom of the screen, that updates in real time. It typically displays team abbreviations, points, quarter, time remaining, shot clock, timeouts, team fouls, and bonus status. Many broadcasts also layer in player statistics, team percentages, turnover counts, rebounding totals, and advanced context such as points in the paint or fast-break points. Arena scoreboards and league apps show similar data, though the layout varies by network and platform. The core purpose remains the same: compress the state of the game into numbers that help viewers understand what is happening now and what is likely to happen next.
This matters because basketball is a clock-and-possession sport. A team trailing by eight with nine minutes left is in a different position than a team trailing by eight with ninety seconds left, even though the score margin is identical. Likewise, a star with twenty points may be dominating, or may be volume scoring inefficiently on twenty-three shots. The scoreboard helps fans answer immediate questions. Who is controlling tempo? Which team is in foul trouble? Is a late comeback realistic? Why did the coach call timeout? Once you can read those numbers quickly, every possession gains context, and that is the foundation for understanding NBA stats as a fan.
The Core Line: Teams, Score, Quarter, Game Clock, and Shot Clock
The most obvious numbers are the team names or abbreviations and the current score. If the graphic reads BOS 102 and MIA 97, Boston leads Miami by five points. Next to that, you will almost always see the period indicator: 1st, 2nd, 3rd, 4th, or OT. NBA regulation games have four twelve-minute quarters. If the score is tied after the fourth quarter, the game goes to a five-minute overtime. Multiple overtimes are labeled 2OT, 3OT, and so on.
The game clock shows how much time remains in the current quarter or overtime. This is one of the most important numbers on the screen because it determines urgency. Down three with 7:30 left is manageable. Down three with 0:18 left changes the math completely, because the trailing team may need a quick three or intentional foul strategy. In the final minute, broadcasts often show tenths of a second after every whistle because exact timing affects shot opportunities, substitutions, and replay reviews.
The shot clock is separate from the game clock and usually appears as a smaller number near it. In the NBA, teams have twenty-four seconds to attempt a field goal that hits the rim. If they fail, it is a shot clock violation and the other team gets the ball. Understanding the shot clock is essential because it explains offensive behavior. If a team starts its set with 20 on the shot clock, it can run multiple actions. If it has only 5, expect isolation, a quick pick-and-roll, or a hurried jumper. After an offensive rebound, the shot clock resets to 14, not 24, under current NBA rules, which speeds up second-chance possessions.
When you watch experienced fans, they constantly read the relationship between game clock and shot clock. If the game clock shows 0:33 and the shot clock shows 22, the offense can hold for nearly the last shot of the quarter. If the game clock shows 0:40 and the shot clock shows 10, there will likely be a two-for-one opportunity, where a team shoots early enough to gain another possession before the quarter ends. That single detail often drives coaching decisions late in quarters.
Team Fouls, Personal Fouls, Bonus, and Free Throws
One of the most misunderstood parts of an NBA scoreboard is the foul display. Team fouls count how many defensive or loose-ball fouls a team has committed in the current quarter. Once a team reaches the penalty, commonly called the bonus, the opponent shoots free throws on most non-shooting defensive fouls. In the NBA, teams enter the bonus on the fifth team foul in a quarter. In overtime, because the period is shorter, the penalty begins on the fourth team foul. If you see a small “Bonus” label or an illuminated marker next to one team, that means the other team will get free throws on the next qualifying foul.
This matters because late-quarter offense changes dramatically against a team in the bonus. Coaches will attack the rim more aggressively, hunting contact and easy points at the line. A scoreboard showing Team A with 4 team fouls and 3:50 left in the quarter tells you they are one whistle away from putting Team B on the line for the rest of the period. That often affects defensive intensity, help rotations, and whether defenders can pressure the ball.
Personal fouls are usually attached to individual players in lineup graphics or player stat cards rather than the main score strip, but they are crucial. A starter with 5 fouls in the fourth quarter is one whistle away from fouling out. Broadcasters often surface that information because it changes matchup options. If a primary rim protector has 5 fouls, drivers may attack him directly. If a star ball-handler has early foul trouble, the coach may sit him longer than planned. On the scoreboard, a player listed with “Pts 18, Reb 6, Ast 5, Fouls 4” is productive, but also at risk.
Free throw displays can include individual percentages, makes and attempts, or team totals. If a player is shown as 7-8 FT, he has made seven of eight free throws. That line matters more late than many fans realize. Teams routinely target poor free throw shooters with intentional fouls in close games. A center shooting 48 percent from the line changes endgame tactics; a guard shooting 91 percent discourages fouling.
Timeouts, Possession, Challenges, and Other Control Indicators
Timeouts are usually shown as small numbers beside each team name. In the NBA, timeouts are strategically valuable because they stop runs, advance the ball in certain late-game situations, and allow coaches to set up specific actions. If a team has no timeouts left with 0:06 remaining, that affects what happens after a made basket or a scramble rebound. They cannot stop play to organize or advance the ball from the backcourt. Fans who track timeouts understand why some coaches save them and why others spend them to halt momentum early.
Some scoreboards also show possession indicators, though the NBA does not use the alternating-possession arrow that college basketball uses after held balls. Instead, jump balls determine possession in tie-up situations. Broadcasts may still use an icon to show which team currently has the ball, especially in digital interfaces. This is useful when replays are on screen and the live score bug remains visible.
Another modern indicator is the coach’s challenge status. Since the NBA introduced the challenge, networks have become more likely to note whether a team has already used it or still has one available. That can matter in close games involving out-of-bounds calls, block-charge decisions, or goaltending reviews. A team without a challenge must live with certain officiating outcomes unless the play is automatically reviewable.
Some broadcasts also include win probability snippets, though these are less common on the constant scoreboard strip. Treat them as context, not certainty. A team with a 78 percent win probability can still lose if a star heats up, foul trouble swings the game, or three-point variance flips momentum in two minutes.
Shooting Numbers: Field Goals, Threes, Free Throws, and Efficiency
Beyond the main score, the next layer of stats for fans is shooting. Broadcast scoreboards commonly show field goals made and attempted, three-pointers made and attempted, and free throws made and attempted. These are usually written as pairs such as 38-81 FG, 11-32 3PT, and 15-19 FT. The first number is makes; the second is attempts. From those numbers you can infer shot profile and efficiency quickly.
If one team is 11-32 from three and the other is 6-18, the first team has both attempted and made more threes. That usually means more spacing, more drive-and-kick offense, or simply more willingness to take perimeter shots. But volume alone is not enough. A team shooting 11-32 is at 34.4 percent, roughly acceptable league-average territory depending on season. A team shooting 6-18 is at 33.3 percent, but on much lower volume. Context matters: similar efficiency with very different shot diet produces different scoring ceilings.
Field goal percentage can mislead if used alone because it treats twos and threes the same. A team shooting 46 percent overall may actually be producing offense more efficiently than a team shooting 49 percent if it is making far more threes and free throws. That is why modern broadcasts often compare points in the paint, second-chance points, and free throw attempts alongside shooting percentages. Those categories explain how the points were created, not just how many were scored.
| Scoreboard Stat | What It Means | How Fans Should Read It |
|---|---|---|
| FG 40-85 | 40 made field goals on 85 attempts | Shows overall shot conversion, but not shot value |
| 3PT 14-36 | 14 made threes on 36 attempts | High volume can raise scoring efficiency even if FG% looks modest |
| FT 18-22 | 18 made free throws on 22 attempts | Signals rim pressure, foul drawing, and late-game execution |
| AST 28 | 28 assists | Usually indicates ball movement and made shots created for teammates |
| TO 11 | 11 turnovers | Lost possessions; often fuel transition chances for the opponent |
| REB 47 | 47 total rebounds | Needs offensive and defensive split for deeper meaning |
As a practical example, imagine a scoreboard showing Team A at 44-90 FG, 16-40 3PT, 10-12 FT, and Team B at 42-82 FG, 8-20 3PT, 18-24 FT. Team B may have the better overall field goal percentage, but Team A has generated eight extra made threes. That is a 24-point edge from long range, enough to outweigh weaker free throw production. This is why experienced fans read the shooting lines before making assumptions about who “shot better.”
Player Stat Lines, Plus-Minus, and What Numbers Matter Most
When a broadcast cuts to a player graphic, you will often see a compact line such as 27 PTS, 9 REB, 6 AST, 2 STL, 1 BLK, 10-18 FG. This is the box score distilled for live viewing. Points, rebounds, and assists are the headline stats because they describe scoring, possession finishing, and playmaking. Steals and blocks highlight defensive events, though they do not capture full defensive value. Turnovers, personal fouls, and minutes are often shown as well.
For fans, the key is to read player stats in combination, not isolation. Twenty-eight points on 11-for-17 shooting with 8 assists usually reflects efficient, high-level offense. Twenty-eight points on 9-for-27 shooting with 2 assists is a very different performance. The scoreboard may also show a player’s three-point line and free throw line, which helps explain whether his scoring came from rim pressure, pull-up shooting, or volume jumpers.
Plus-minus sometimes appears in app scoreboards or expanded TV graphics. If a player is +14, his team has outscored the opponent by 14 while he was on the floor. If he is -9, his team was outscored by 9 during his minutes. Plus-minus is useful over a single game for lineup context, but it is noisy. A bench player can be +12 because he shared the floor with four starters during a hot stretch. Treat it as a clue, not a verdict.
Minutes matter more than casual viewers think. A star with 16 points in 18 minutes may be on pace for a huge game if he avoids foul trouble. A reserve with 12 points in 28 minutes is contributing, but likely in a smaller offensive role. Per-minute context helps fans project second-half impact and understand why coaches stagger lineups.
Team Comparison Stats That Explain Momentum
Many NBA scoreboards rotate secondary team stats beneath the main line. Common examples include rebounds, offensive rebounds, assists, turnovers, points in the paint, fast-break points, bench points, second-chance points, and largest lead. These numbers help explain why the score is what it is. If a team leads by seven despite shooting worse from the field, the answer may be hidden in offensive rebounds and free throws. If a team erased a double-digit deficit, bench scoring or turnover margin often tells the story.
Rebounding deserves careful reading. Total rebounds alone can be misleading because a team that misses more shots creates more rebound opportunities for both sides. Offensive rebounds are often more revealing. If Team A has 15 offensive rebounds to Team B’s 6, that means Team A has extended possessions and likely generated extra attempts or putbacks. Turnovers are equally important because they remove scoring chances and often create easy transition points for the opponent.
Points in the paint show interior scoring success, but they are not just about centers posting up. Drives, cuts, dump-off passes, and transition layups all count. A guard-heavy team can win the paint battle by constantly collapsing the defense. Fast-break points indicate transition offense, usually created by steals, long rebounds, or quick outlet passing. Bench points reflect non-starters, which is valuable for understanding depth over an 82-game season and in regular-season back-to-backs.
Largest lead is a useful emotional stat, but not always predictive. A team that once led by 18 may still be vulnerable if the current score is tied and key players are in foul trouble. Read it as a summary of game flow, not proof of control.
How to Use the Scoreboard Like a Smart Fan
The best way to read an NBA scoreboard is to ask a sequence of simple questions. What is the score and how much time is left? What does the shot clock suggest about the next possession? Is either team in the bonus? Who has foul trouble? Which team is winning the possession battle through rebounds and turnovers? Are the shooting numbers sustainable, or is one side surviving on unusually hot three-point shooting? This habit turns the scoreboard from decoration into a live strategy map.
It also helps to know what the scoreboard does not show. Defensive communication, off-ball screening, matchup hunting, weak-side rim deterrence, and stamina are often decisive but only partially visible in stats. That is why the best fans combine numbers with what they see. If the scoreboard says a team has only 8 turnovers but the eye test shows repeated rushed possessions ending in bad shots, the offensive process may still be poor. Numbers inform the game; they do not replace watching it carefully.
As the hub for stats for fans, this guide gives you the base vocabulary for every other NBA numbers discussion. Once you can read the scoreboard cleanly, box scores make more sense, player debates become sharper, and advanced metrics feel less intimidating. Start by tracking the core line, team fouls, timeouts, and shooting splits during your next game. Within a few quarters, the screen will stop looking crowded and start looking readable, and that is when basketball becomes much more rewarding to follow.
Frequently Asked Questions
What do the game clock and shot clock mean on an NBA scoreboard?
The game clock shows how much time is left in the quarter, while the shot clock shows how much time the offensive team has to attempt a legal shot. In the NBA, each quarter lasts 12 minutes, and the game clock counts down to 0:00. The shot clock usually starts at 24 seconds when a team gains possession. To satisfy the shot clock, the team must release a shot before time expires, and that shot must touch the rim if it misses. If the shot clock runs out first, it is a shot clock violation and the other team gets the ball.
Once you understand these two clocks together, the pace of the game becomes much easier to read. For example, if the game clock shows 1:05 left in the quarter and the shot clock shows 20, the offense has plenty of time to run a full possession. But if the game clock shows 18 seconds and the shot clock is off or nearly aligned with the game clock, teams often hold for the final shot so the opponent does not get another chance. That is why broadcasters talk about a “two-for-one” opportunity late in a quarter: a team moves quickly enough to get one shot up and still leave enough game clock to force another possession before the period ends.
The shot clock also resets differently depending on what happens. A new possession usually brings a full 24 seconds. An offensive rebound may reset the clock to 14 seconds instead of 24, depending on the situation, which creates a faster, more urgent possession. On a live scoreboard, those numbers tell you whether a team is flowing freely, rushing to avoid a violation, or slowing down to control the end of a quarter. For a new fan, reading the relationship between the game clock and shot clock is one of the fastest ways to understand strategy in real time.
What do team fouls, the bonus, and free throw indicators tell you during a game?
Team fouls show how many personal fouls a team has committed in the current quarter. This matters because once a team reaches the penalty, commonly called “the bonus,” the other team begins earning free throws on many non-shooting fouls. On an NBA scoreboard, you will usually see a foul count next to each team and some visual signal such as “BONUS,” a dot, or another indicator when the penalty has been reached.
In practical terms, this changes how both teams play. Early in a quarter, a defender might use a more physical foul to stop a drive or break up a fast break because the offensive team will inbound the ball rather than shoot free throws. But once the defense is in the bonus, that same reach-in foul can send the opponent to the line for two free throws. That is a major strategic shift, especially late in close games. Coaches become more cautious, ball handlers attack more aggressively, and broadcasts start pointing out which team is “in the penalty” because every whistle suddenly has more value.
The free throw indicator on a scoreboard may also show how many shots a player is about to take, such as “2” for two shots, or it may simply appear as part of the broadcast graphic when a player is at the line. This helps viewers understand the context of the stoppage immediately. If you see a team with five team fouls early in the final minutes of a quarter, that is not just a stat on the screen. It is a warning sign that the offense can pressure the defense, draw contact, and score with the clock stopped. For reading momentum and end-game strategy, the foul and bonus section of the scoreboard is one of the most important areas to watch.
What is the possession indicator, and how is it different from college basketball’s possession arrow?
This is one area that confuses many new viewers because not every basketball scoreboard works the same way. In the NBA, there is no alternating possession arrow like the one commonly used in college basketball to settle jump-ball situations. Instead, most tie-ups in the NBA result in an actual jump ball between the two players involved. So if you are looking for the traditional college-style possession arrow on an NBA scoreboard, you usually will not find one because that rule system does not apply.
What you may see on an NBA broadcast instead is a small possession marker showing which team currently has the ball. This is not an alternating-arrow rule device. It is simply an on-screen indicator for viewers, often useful when the camera angle cuts away or when a scoreboard graphic remains on screen during replays. In some broadcast packages, it may be subtle, such as a small triangle or highlight next to a team abbreviation.
The key difference is that a college possession arrow predicts who gets the ball on the next held-ball situation, while an NBA possession indicator usually just tells you who has the ball right now. That distinction matters because it affects how you interpret game management. In the NBA, a tie-up does not trigger an automatic handover based on an arrow; it often leads to a center-court style jump ball. So if you are trying to read an NBA scoreboard accurately, do not assume every small symbol near the score means the same thing it does in other levels of basketball. In the NBA context, possession information is about current control, not future entitlement.
How do field goal, three-point, and free throw percentages on the scoreboard help explain what is happening in the game?
Shooting percentages give you a quick snapshot of efficiency. Field goal percentage shows how often a team or player is making all shot attempts from the floor. Three-point percentage isolates shots from beyond the arc. Free throw percentage tracks success at the line. On some scoreboards, you may also see makes and attempts listed directly, such as 28-for-61 from the field or 9-for-27 from three. Those numbers are often more revealing than the percentage alone because they show volume as well as accuracy.
These stats help explain whether a lead is built on sustainable offense, hot shooting, or simple shot volume. For example, if one team is shooting 52% from the field while the other is at 43%, that suggests better shot quality, better execution, or both. But if the lower-percentage team has taken 10 more shots because of offensive rebounds and fewer turnovers, the game may still be close. That is why experienced viewers do not read shooting splits in isolation. They connect them to pace, rebounding, and possessions.
Three-point numbers are especially powerful for reading momentum. A team shooting 6-for-11 from deep may be on a heater, forcing the defense to stretch out and changing driving lanes for everyone else. On the other hand, a team shooting 4-for-22 from three may not necessarily be playing badly if many of those are good looks that just are not falling. Free throw stats can reveal another layer: if one team has attempted far more free throws, it may be attacking the paint more often, drawing fouls, and controlling the physical tone of the game. In short, the shooting section of the scoreboard helps you move beyond “who is winning” and toward “why they are winning.”
What do the player stat lines on the scoreboard mean, and which numbers matter most during live play?
Player stat lines are the compact summaries you see beside a player’s name, usually showing points, rebounds, assists, and sometimes steals, blocks, fouls, field goal shooting, plus/minus, or minutes played. These numbers are useful because they condense a player’s impact into a quick reference, but they need context to be interpreted correctly. A player with 18 points may look dominant, but if he needed 20 shots to get there, that is a very different performance from someone with 18 points on 8-of-11 shooting.
During live play, the most meaningful numbers often depend on the moment. Points are the easiest stat to notice, but fouls can be just as important because they affect who can stay on the floor. If a star player has four fouls in the third quarter or five in the fourth, that becomes a major strategic issue. Minutes played can tell you whether a starter is being pushed hard, while assists may show who is organizing the offense. Rebounds matter because they often reveal who is controlling possessions, and a sudden spike in offensive rebounds can explain why one team is generating repeated scoring chances.
It is also helpful to watch shooting splits within player lines, such as 7-for-9 from the field or 1-for-6 from three. Those numbers tell you immediately whether a player is scoring efficiently or struggling. Some broadcasts also show plus/minus, which measures the scoring margin while that player is on the court. Plus/minus can be useful over a game or season, but in a single live window it should be treated carefully because it can be influenced by lineup combinations as much as individual performance. The best way to read player lines is to combine them with what you are seeing on the floor. The scoreboard gives you the clues, but the real value comes from matching those numbers to role, matchup, and game situation.