
Analytics changed NBA coaching by turning every possession into measurable information, every lineup into a testable hypothesis, and every strategic choice into a decision that can be evaluated against evidence. In the modern league, analytics refers to the systematic use of data, video, probability models, and performance tracking to improve tactics, player development, rotation management, health decisions, and front-office planning. Coaching once relied primarily on experience, intuition, and film study. Those tools still matter, but they now operate alongside shot charts, possession-based efficiency metrics, lineup databases, player-tracking feeds, and machine-assisted scouting reports. This shift matters because the margins in the NBA are small. A few points per 100 possessions can separate a contender from a play-in team, and the difference often comes from decisions made on the sideline: who plays, where shots come from, when to switch, how to stagger stars, and how to defend specific actions. After working with basketball data and coaching workflows, I have seen the best staffs use analytics not as a replacement for basketball judgment, but as a filter that sharpens it. The data revolution on the sidelines did not remove the human element. It made coaching more precise, more accountable, and more adaptable under pressure.
From box scores to player tracking: how the analytics era began
For decades, NBA coaching analysis centered on points, rebounds, assists, shooting percentage, and plus-minus observed through the eye test. Those numbers were useful but incomplete. They rarely explained shot quality, spacing impact, lineup context, defensive versatility, or how a possession actually unfolded. The analytics movement accelerated when teams began adopting possession-based thinking. Dean Oliver’s Four Factors gave coaches a practical framework: shooting efficiency, turnovers, rebounding, and free throws drive winning. That idea changed how staffs evaluated game plans. Rather than chasing raw totals, coaches started asking which actions produced efficient shots, which lineups protected the ball, and which defensive coverages limited free throws and offensive rebounds.
The transformation deepened with optical tracking and play-type databases. STATS SportVU, introduced leaguewide in the 2013-14 season, gave teams detailed information on player speed, distance covered, touch time, defender proximity, drive frequency, and shot contest quality. Synergy Sports allowed staffs to tag and quantify possessions by action: pick-and-roll ball handler, spot-up, handoff, post-up, off-screen, cut, transition, and more. Second Spectrum expanded tracking further with spatial data and automated event labeling. Suddenly, coaches did not have to rely on memory to judge whether a drop coverage was conceding too many pull-up threes or whether a pet set generated efficient looks. They could measure it over hundreds of possessions with video attached.
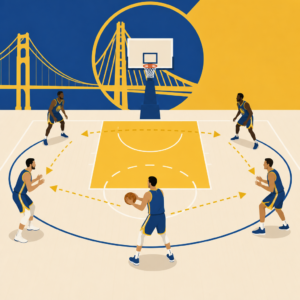
This mattered because the NBA was changing tactically. Pace-and-space offenses, five-out alignments, and increased three-point volume forced coaching staffs to make evidence-based adjustments quickly. The 2014 Spurs demonstrated how ball movement and spacing could overwhelm elite defenses. The Warriors then showed that shot profile, transition pressure, and switchable defense could scale to dynasty level. Their success did not come from spreadsheets alone, but analytics validated many of the choices that defined that era: more threes, fewer long twos, versatile defenders, and lineups optimized for space.
Shot selection and offensive design became data-driven
The most visible impact of analytics on NBA coaching is shot selection. Coaches now design offenses around expected value. A corner three, a rim attempt, or a free throw trip is usually more efficient than a contested midrange jumper. That principle did not eliminate the midrange shot, but it changed when and why teams use it. The Houston Rockets under Daryl Morey and Mike D’Antoni became the clearest example. Their offense emphasized threes, layups, and free throws to an extreme degree. Coaches structured spacing to create either a switch they could attack or a driving lane that forced rotation. James Harden’s isolation game was not just aesthetically distinctive; it was mathematically efficient because it generated high-value outcomes at volume.
On the sideline, this changed play calling. Coaches stopped thinking only in terms of getting a good shot and started targeting the best shot for that personnel against that coverage. If tracking data showed a weak-side defender consistently helped one step too far into the paint, staffs built sets that punished that tag with a corner three. If a center dropped too deep against pick-and-roll, coaches increased pull-up three volume. If a team switched one through five but struggled to defend slips, offenses emphasized ghost screens and short-roll playmaking. Analytics made offensive design more granular because it connected scheme to specific efficiencies.
The numbers also reshaped player development. Big men were encouraged to extend range because spacing improved overall team efficiency even when the individual shooter was only average. Guards were trained to finish through contact, manipulate drop defenders, and make quick reads to the dunker spot. Wings worked on catch-and-shoot timing from NBA three-point depth because stationary spacing matters as much as star creation. As a result, coaching staffs now blend skill instruction with efficiency maps. A player may still practice floaters or elbow jumpers, but those shots are framed by context: late clock, weak defender in retreat, or coverage that takes away the rim.
Defense adjusted with equal speed and precision
Analytics did not only fuel offensive innovation. It changed NBA defense by helping coaches identify which shots and actions they were willing to concede. Modern defensive game plans are built on selective surrender. A staff may decide that forcing above-the-break pull-up twos from a mediocre handler is preferable to allowing corner threes or rim attempts. That sounds simple, but it requires detailed data on opponent tendencies, screening angles, help timing, and lineup-specific weak points.
In practical terms, this is why defensive coverages have multiplied. Coaches now toggle between drop, weak, ice, show, blitz, switch, peel switch, top lock, zone, and matchup zone based on opponent efficiency by action and personnel. A team facing Stephen Curry cannot defend handoffs the same way it would defend a non-shooting guard. Tracking and play-type data show exactly how damaging certain coverages become against elite creators. When I have reviewed opponent scouting packets, the strongest ones never stop at broad principles. They identify exact pressure points: which side a guard rejects more often, what happens when a screener short rolls, how frequently a wing relocates after a drive, and how a bench unit performs against switching.
Defensive rebounding and transition control also became measurable coaching priorities. Teams now track crash rates, floor balance, sprint-backs, and cross-matches after missed shots. If a team sends too many players to the offensive glass, it may sacrifice transition defense. Coaches can quantify that tradeoff by comparing second-chance gains against fast-break points allowed. That level of precision helps staffs build consistent rules instead of relying on generalized effort demands.
| Coaching area | Common metric or tool | How it changes decisions |
|---|---|---|
| Shot selection | Effective field goal percentage, shot charts, defender distance | Increases rim and three-point attempts while reducing low-value long twos |
| Pick-and-roll defense | Synergy play-type efficiency, tracking clips, points per possession allowed | Determines when to switch, drop, blitz, or hedge against specific opponents |
| Lineups | Net rating, rebounding rate, turnover rate, spacing data | Optimizes substitutions and staggering patterns |
| Player workload | Minutes trends, movement load, acceleration data, wellness reporting | Shapes practice intensity, rest plans, and back-to-back usage |
| Scouting | Second Spectrum tags, shot location data, play frequency reports | Builds opponent-specific game plans with clear priorities |
Rotations, lineups, and in-game adjustments became more evidence-based
One of the hardest coaching jobs is deciding which five-man groups should play together and when. Analytics changed that process by giving staffs lineup data far beyond raw plus-minus. Coaches now examine net rating, opponent shot profile allowed, rebounding percentage, turnover creation, pace, foul rate, and spacing indicators for different combinations. A lineup that looks strong in highlights may fail because it cannot rebound or generate paint pressure. Another lineup may survive despite limited scoring because it forces turnovers and wins the possession battle.
Rotation strategy became more sophisticated as coaches learned to stagger stars and protect weak bench units. The goal is not simply to start the best players. It is to distribute creation, spacing, rim protection, and defensive communication across 48 minutes. The best staffs use data to identify pairings that stabilize non-star stretches. For example, a second unit may need one high-assist guard, one vertical spacer, and at least two trusted point-of-attack defenders to function. Without analytics, coaches often took longer to isolate those dependencies.
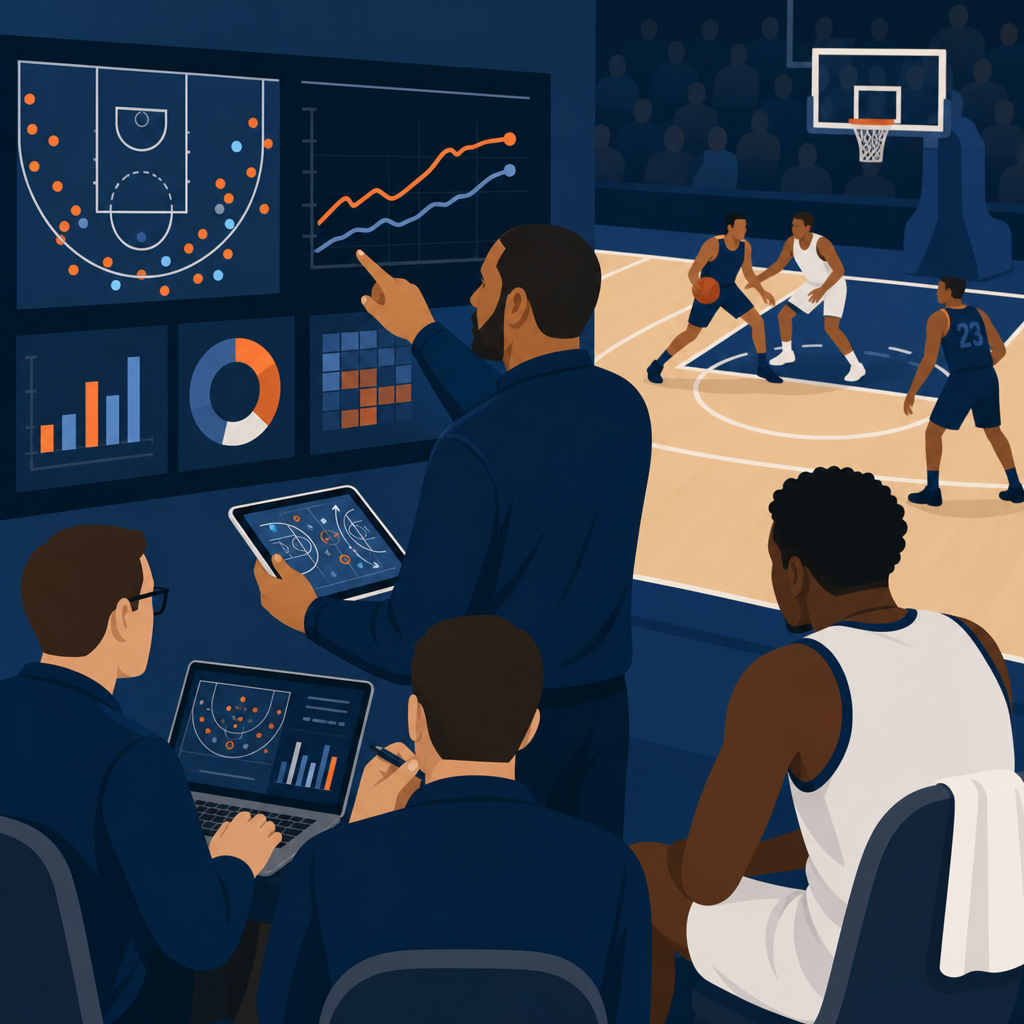
Timeout adjustments also improved. Real-time analytics teams can flag transition leak issues, identify actions producing repeated breakdowns, or note that a specific help defender is tagging too low on empty-side pick-and-roll. On television, this may look like a coach making a feel-based change. In many organizations, there is a flow of information from analysts, video coordinators, and assistants that supports those choices. The head coach still makes the final call, but the process is more informed than fans usually realize.
There are limits, and strong coaches understand them. Small-sample lineup data can mislead. Garbage-time possessions distort numbers. Matchup context matters. A group that dominates slower teams may fail against elite switching defenses. That is why serious NBA staffs blend statistical confidence with film verification. The strongest adjustment process is iterative: data surfaces the question, film explains the answer, and coaching judgment decides the response.
Scouting, player development, and load management entered the same ecosystem
Analytics now connects nearly every department around a coaching staff. In opponent scouting, reports no longer stop at star tendencies. They map role-player behavior too: who lifts from the corner on drives, who cuts behind ball watching defenders, who rejects pindowns, who crashes from the dunker spot, and who is reluctant to shoot above the break. This matters in playoff series, where weak links decide outcomes. Coaches can script help rules with unusual specificity because the data and video support it.
Player development became similarly targeted. If a young wing scores efficiently as a cutter but struggles as a pick-and-roll handler, training plans can emphasize handle improvement without abandoning off-ball strengths. If tracking data shows a guard creates rim pressure but fails to convert because he avoids contact, coaches can teach angle manipulation and deceleration. If a big contests shots well but commits too many fouls on second jumps, film and event data can isolate the timing problem. Development is faster when feedback is measurable.
Load management and health strategy also changed coaching behavior. Teams monitor minutes, high-intensity movements, jump counts, and subjective wellness to reduce injury risk and improve recovery. The exact models differ by team, and no system can predict every injury, but the logic is sound: coaching decisions should account for fatigue accumulation, not just game-day readiness. This affects practice planning, travel recovery, and back-to-back rotations. Veteran coaches who once prized hard daily sessions now often use shorter, sharper practices because the season is too dense to ignore physical load.
The broader lesson is that analytics works best when it is integrated, not isolated. A number on a dashboard matters only if it changes teaching, planning, or communication. The best organizations create that feedback loop from scouting to player development to game management.
Why analytics did not replace coaching instinct
The strongest argument against a simplistic view of analytics is visible every postseason. Playoff basketball is too dynamic for formulas alone. Opponents adjust within games, stars exploit tiny openings, and emotional control matters as much as tactical precision. Coaches still need conviction, communication skill, and feel for rhythm. A model can suggest that a lineup is efficient, but it cannot fully capture whether a player is rattled, whether a veteran sees a coverage early, or whether a bench group trusts its roles.
What analytics did was upgrade instinct. It gave experienced coaches better questions, better context, and a way to test assumptions. The best sideline leaders use data to challenge bias. Maybe a trusted veteran is actually hurting spacing. Maybe a bench scorer’s volume hides poor efficiency. Maybe a conservative coverage protects the rim but gives up too many rhythm threes. These are coaching truths that numbers can reveal before losses pile up.
That balance defines the modern NBA. Coaching is no longer just speech, substitution, and motivation. It is the practical application of information under pressure. The staffs that thrive are the ones that can translate analytics into language players accept: simple terminology, clear priorities, and actionable corrections. Data has changed the NBA sidelines because it made coaching smarter without removing the craft. If you want to understand today’s league, study the numbers behind the decisions, then watch how great coaches turn those numbers into winning habits. That is where the real revolution happened.
Frequently Asked Questions
What does analytics actually mean in NBA coaching?
In NBA coaching, analytics means using data to guide basketball decisions instead of relying only on instinct, tradition, or what “looks right” in the moment. That includes basic statistics, advanced metrics, lineup efficiency data, player-tracking information, shot charts, video breakdown, biomechanical analysis, and probability models. Coaches and their staffs study how efficient certain plays are, which lineups perform best together, where players shoot most effectively, how opponents defend specific actions, and how pace, spacing, and shot selection influence outcomes over the course of a game or season.
On the sidelines, analytics turns coaching into a more evidence-based process. A coach can compare how a team performs in pick-and-roll, isolation, transition, or post-up situations and then emphasize the actions that consistently produce better results. Defensive strategy is shaped the same way. Data can show whether a team should switch more often, drop its big men in coverage, trap certain ball handlers, or force opponents into less efficient mid-range attempts. In that sense, analytics is not separate from coaching. It is a tool that helps coaches test assumptions, confirm patterns, and make smarter tactical choices with more confidence.
How has analytics changed game strategy and in-game decision-making?
Analytics has transformed NBA strategy by showing coaches which shots, actions, and matchups produce the best expected value. One of the clearest examples is shot selection. Teams now place far greater emphasis on three-pointers, free throws, and shots at the rim because data has repeatedly shown those are usually the most efficient scoring opportunities. As a result, coaches have redesigned offenses around floor spacing, drive-and-kick actions, high pick-and-roll, and quick decision-making to create those high-value looks. On defense, coaches use analytics to take away the most efficient shots and live with lower-value attempts, even if those shots were once considered acceptable.
In-game management has changed as well. Coaches now have much more information about lineup combinations, fatigue patterns, foul tendencies, matchup vulnerabilities, and end-of-game scenarios. Analytics can help determine whether a certain bench unit is actually outperforming a more talented lineup, whether a player should be used as a screener rather than a primary ball handler, or whether a team should foul when up three late in the game depending on time and personnel. Timeout usage, substitution timing, challenge decisions, and late-clock play calls can all be informed by probability and historical outcome data. The result is not robotic coaching, but more precise coaching, where decisions are increasingly tied to evidence rather than habit.
Does analytics replace coaching instinct, experience, and basketball feel?
No, analytics does not replace coaching instinct; it sharpens it. The best NBA coaches do not treat data as a substitute for leadership, communication, or basketball intelligence. They use it as another layer of understanding. Experience still matters because numbers do not automatically explain locker room dynamics, player confidence, emotional momentum, effort level, or how a team will respond under pressure. A veteran coach can sense when a player needs encouragement, when a star should be trusted to play through a slump, or when a group needs a tactical adjustment that may not be obvious in a spreadsheet.
What analytics does is challenge assumptions and reduce blind spots. A coach may feel that a lineup is effective because it appears energetic or disciplined, but the data may reveal it struggles to rebound, defend the three-point line, or score efficiently in half-court sets. On the other hand, a lineup that seems awkward may actually be producing excellent results over meaningful minutes. The strongest coaching staffs combine objective measurement with subjective judgment. They watch film, understand personalities, and read the game in real time, while also using analytics to verify what they think they are seeing. In today’s NBA, the real advantage comes from blending feel and facts, not choosing one over the other.
How do analytics influence player development, rotations, and load management?
Analytics plays a major role in helping coaches develop players more efficiently and deploy them more effectively. For player development, data can identify specific strengths and weaknesses that might otherwise remain vague. Instead of telling a player to simply “be more aggressive,” coaches can show that he scores efficiently attacking closeouts to his right, struggles with pull-up jumpers from certain areas, or creates better outcomes when making faster reads in pick-and-roll situations. Shooting coaches can use tracking data to monitor release consistency, shot quality, and performance by zone. Defensive development also benefits, with analytics highlighting issues such as late rotations, screen navigation problems, foul patterns, or weak rebounding positioning.
Rotations are shaped by the same principles. Coaches now study which player combinations generate the best net rating, spacing, ball movement, defensive versatility, and rebounding balance. That helps determine who should start, who should close, and which bench groups make the most sense against specific opponents. Load management and health decisions are also influenced by data, especially as teams monitor minutes, movement patterns, recovery, injury risk indicators, and performance drops tied to fatigue. While coaches still need to consider player rhythm, competitiveness, and schedule context, analytics gives them a clearer framework for preserving performance over an 82-game season and into the playoffs. It has made minute distribution, rest planning, and developmental strategy much more intentional.
Why has analytics become so important to the overall success of NBA teams?
Analytics has become essential because the NBA is too competitive, too fast, and too financially significant for teams to ignore useful information. Margins between winning and losing are often small, and even slight improvements in shot selection, lineup optimization, defensive coverage, or injury prevention can have major effects over a full season. Coaches, front offices, and performance staffs are all looking for ways to gain an edge, and analytics helps uncover patterns that are difficult to detect consistently with the naked eye alone. It allows organizations to evaluate not just what happened, but why it happened and whether it is likely to continue.
Its importance also extends beyond the bench. The modern data revolution connects coaching with scouting, roster construction, sports science, and long-term planning. Coaches can align their systems with personnel more effectively, front offices can target players whose skills fit the numbers behind successful lineups, and medical staffs can collaborate on recovery and workload decisions. In that sense, analytics has changed NBA coaching because it has changed the entire ecosystem around coaching. The head coach is no longer making decisions in isolation. He is operating within a larger evidence-driven structure designed to maximize every possession, every player, and every competitive advantage available. That is why analytics is not a trend on the sidelines; it is now a core part of how elite NBA teams function.